

Consumer spending is the meat-n-veg of economic growth but doesn't get the attention it deserves because of the cameo performances regularly put on by the likes of the housing market and dairy product prices.
The Reserve Bank and the economic forecasters in general are predicting that consumer spending growth will slow over the next year and not improve thereafter.
This view is the result of an excessive focus on the fall in dairy farm incomes and insufficient focus on the boost to consumer spending from the fall in interest rates and the surges in immigration and net migration.
Sound and balanced analysis of the drivers of consumer spending points to stronger not weaker growth ahead, with this view starting to get support from the leading indicators, like the ANZ Roy Morgan monthly consumer survey.
If the Reserve Bank and economic forecasters in general can't predict consumer spending growth reasonably accurately, they can forget about being able to predict the likes of the unemployment rate, inflation and interest rates.
Even the Reserve Bank has an atrocious track record at predicting interest rates.
The economic forecasters are too pessimistic about consumer spending prospects
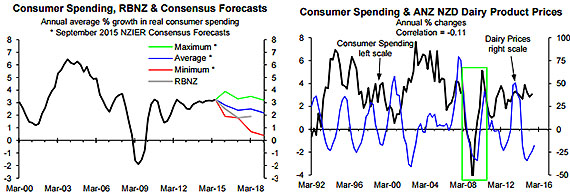
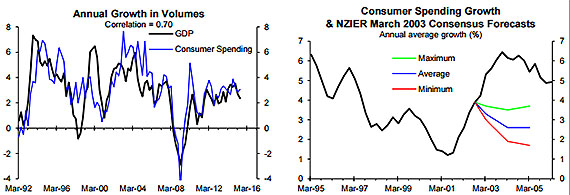
Once a quarter NZIER surveys nine of the economic forecasters including the Reserve Bank and most of the bank economists and supplies the results in the Consensus Forecasts report (see the link below for the latest edition). The consensus or average view of the nine economic forecasters surveyed by NZIER is that consumer spending growth will slow from 3.1% in the 2014/15 March year to 2.8% in 2015/16 and 2.4% in 2016/17, improve marginally to 2.5% in 2017/18 and then slow to 2.2% in 2018/19 (see the blue line in the left chart below for the consensus or average predictions for consumer spending growth).
The left chart shows annual growth in the volume of consumer spending (e.g. growth in the number of TVs and pork chops sold) as opposed to growth in the value of spending. Consumer spending includes spending at retail stores by individuals (not businesses) plus spending by individuals on a wide range of other non-retail goods and services (e.g. insurance, healthcare, travel, etc.). NZIER also releases the maximum and minimum forecasts for each of the March years by any of the nine forecasters (see the green and red lines, respectively, in the left chart below that also includes the Reserve Bank's forecasts from the September Monetary Policy Statement).
The economic forecasters and especially the Reserve Bank, that is more pessimistic about consumer spending growth prospects than are the nine forecasters on average, are assuming the fall in dairy farm incomes will make a sizeable negative contribution to consumer spending growth over the next year. In general they expect the fall in dairy farm incomes to more than offset the stimulus from a sizeable fall in interest rates, the surge in net migration that is adding almost 70,000 to the population per annum and house price inflation that should remain well above 10% next year.
The view that falling dairy farm incomes necessarily means slower growth in consumer spending is not supported by the historical experience. There is no clear or consistent link between consumer spending growth and the annual % change in dairy product prices other than when the financial crisis temporarily drove both (see the right chart above, with the boxed area highlighting the brief period the two were linked). The correlation between the two is mildly negative rather than significantly positive even if I allow up to 12 months for changes in dairy product prices to impact on consumer spending. The right chart above makes an extremely strong case for believing that factors other than dairy farm incomes are dramatically more important drivers of consumer spending growth.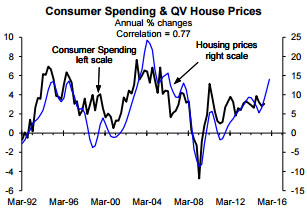
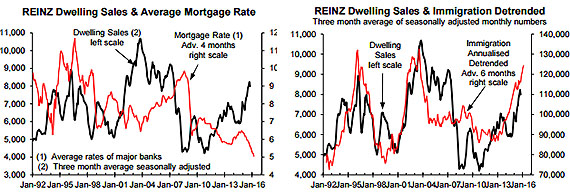
By contrast, the reasonably high positive correlation between consumer spending growth and house price inflation shown in the adjacent chart starts to shed light on what the key drivers of consumer spending growth are. Interest rates and immigration are the major drivers of cycles in existing house sales, as shown in the two charts below. The left chart shows the average mortgage interest rate offered by the major banks advanced or leading by four months, with interest rates being the most powerful driver of cycles in the number of house sales. The right chart shows immigration advanced or leading by six months to be an important secondary driver of house sales. Immigration is secondary in the sense that if interest rates and immigration point to different outcomes for house sales, house sales will head in the direction interest rates are predicting, but major cycles in immigration still have a sizeable impact on house sales.
The 1 October tax changes and the 1 November tightening of lending restrictions for Auckland investors may temporarily offset the stimulus in the pipeline from the fall in interest rates over the last four months and the resumed surge in immigration. But my best guess is that there will be resumed upside in house sales early next year, while house price inflation follows the number of house sales and hasn't fully reflected in the increase in sales so far, as covered in the Housing Prospects reports.
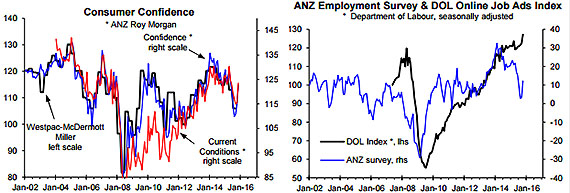
My point isn't that house prices are the key driver of consumer spending, but rather that interest rates and immigration (or net migration that also includes the impact of fewer Kiwis emigrating currently) are the key drivers of both house price inflation and consumer spending growth. So even if the tax changes and LVR restrictions slow national house price inflation temporarily/slightly, the fall in interest rates and stronger population growth should overpower the negative impact of the fall in dairy farm incomes and drive stronger growth in consumer spending. This is an idea that has lots of support from the historical experience and is starting to gain support from the leading indicators (see the rebound in the ANZ Roy Morgan monthly consumer surveys in the left chart below and the improvement in the leading indicators of employment in the right chart below).
My assessment of the key drivers of consumer spending leads me to expect growth to improve not slow below average as the economic forecasters are predicting and my view is starting to gain support from the relevant leading indicators. If you want valuable insights into prospects for consumer spending and the economy more generally rather than some of the half-baked ideas the economic forecasters come out with too often, you need to read our monthly economic reports.
Implication of awakening the slumbering giant
Relative to the contribution it makes to economic activity or GDP (59% in the 2014/15 June year), consumer spending doesn't get enough attention. The left chart below shows a reasonably high correlation of 0.70 between consumer spending and GDP growth since 1992, but the correlation is much higher at 0.86 over the last 10 years compared to a maximum possible 1.0 (i.e. 0.86 is like getting an 86% mark in an exam). Consumer spending is a bit like the slumbering giant of the economy. It doesn’t do the cameo performances the housing market and dairy product prices are renowned for and that get them lots of media attention, but it is the meat and vegetables of economic growth. Consequently, if the economic forecasters can't predict consumer spending reasonably accurately they can forget about being able to forecasts GDP growth, the unemployment rate, interest rates and the exchange rate.
The analysis in our housing and economic reports points to reasonably strong parallels between 2016 prospects and what happened in 2003 when consumer spending and GDP growth last performed strongly. The strong growth in 2003 was preceded by a sizeable fall in interest rates, high immigration/net migration and a large fall in dairy product prices (i.e. there are strong parallels between the performances of the key drivers of economic growth leading up to the strong growth in 2003 and what they have done recently). And just as the economic forecasters are currently predicting slower growth for consumer spending, in March 2003, on the verge of strong growth, the economic forecasters surveyed by NZIER were on average predicting slower growth for consumer spending (blue line, right chart below). Even the most optimistic of the forecasters surveyed by NZIER in March 2003 wasn't predicting the sharp improvement in consumer spending growth that occurred during 2003 (green line, right chart), which is also similar to the current situation (see the green line, top left chart on page 2).
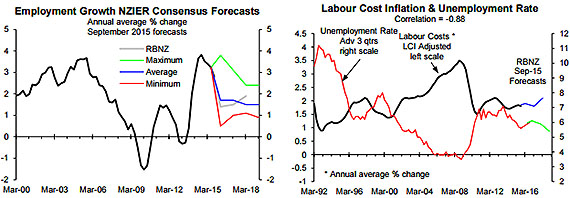
If consumer spending and GDP growth turn out to be significantly stronger than the economic forecasters are predicting (setting aside any temporary setback from drought this summer), employment growth will be stronger than they are predicting (see the left chart below for the consensus and Reserve Bank employment growth forecasts). The unemployment rate will fall significantly more than the Reserve Bank is predicting and productivity-adjusted labour cost inflation will increase more (right chart below).
And interest rates will increase more and earlier than the economic forecasters are on average predicting (blue line, left chart below for the latest consensus forecasts), while the Reserve Bank's interest rate forecasters will prove to be well off the market again (see the gray line in the left chart below for the Reserve Bank's latest predictions for the 90-day bank bill yield, which are effectively OCR predictions).
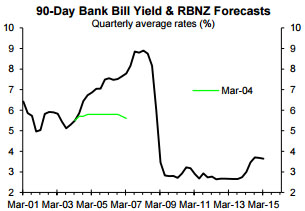
Every now and then my old employer the Reserve Bank likes to remind us that it has a more accurate forecasting track record than the forecasters in general, but this is like a 3/4 rotten apple skiting about being ripe for eating. Back in March 2004, after Governor Bollard delivered the first of 13 OCR hikes, the Reserve Bank was predicting upside in the unemployment rate and downside in the productivity-adjusted measure of labour cost inflation, when the opposite happened (right chart below). The Reserve Bank was also predicting almost no further upside in the 90-day bank bill yield, which means it was predicting no more OCR hikes on the eve of massive upside in interest rates (2nd left chart below).
The traditional approach to economic forecasting is a joke, but the forecasters keep rolling out halfbaked predictions, encouraged by the media reporting the views of the forecasters with the worst track records as much as the minority with better track records. In fairness to the media, the major mistakes the economic forecasters make can only be viewed clearly with the aid of a long-term perspective (e.g. 30 years). Such a perspective reveals the massive mistakes the economic forecasters made in the mid-2000s in not realising strong growth in consumer spending and GDP growth, and significant upside in interest rates were imminent, with the forecasts also making the same mistake in the mid-1990s. It is like the forecasters get infected by mid-decade madness. This reflects the lack of quality analysis done by the forecasters, the tendency by many of them to flock together and a lack of willingness or ability to point out when the Reserve Bank's forecasters have lost the plot (i.e. when the governor has lost the plot).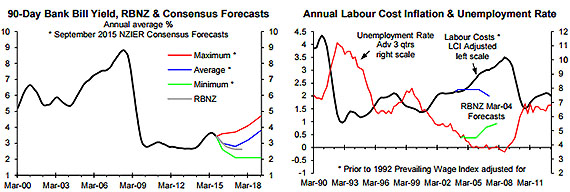
At the moment it is encouraging to see some divergence in views on interest rates prospects from the bank economists (i.e. Westpac and ASB, bizarrely based on my analysis, arguing for several more OCR cuts, while ANZ and BNZ are urging against another cut this year). But what is missing are predictions that the OCR cuts are misguided because they are based on an excessive focus on a factor of no relevance to medium-term inflation prospects (i.e. the fall in dairy farm incomes), meaning there is a real risk the OCR cuts will end up being more than reversed (i.e. a repeat of the experiences in the 2000s and 1990s).
It is nothing new for me to be a lone voice in warning that economic prospects are materially different from what the Reserve Bank and economic forecasters in general are predicting. This isn't because I am inherently contrarian or counter-culture. It is because my analysis, that has much better foundations than the economic forecasting models used by the likes of the Reserve Bank, leads to different conclusions. If you want quality insights as input into your business and/or investment decisions, I recommend you try one of the trial subscriptions we are offering to celebrate our 10th anniversary and get the full story.
----------------------------------------------
*Rodney Dickens is the managing director and chief research officer of Strategic Risk Analysis Limited.


